TEX

Currently soccer club PSV is tracking their players on the field for around 6 hours a day. Tex provides contextual information like energy level, soreness, sleep and life events to the quantitative data collected from athletes. Subjective well-being related data is collected in a rich, expressive and enjoyable way. Leading to better data validity, user engagement and less reporting burden. By making use of Tex players can be remotely monitored on a daily basis. Tex comes with a digital platform that communicates the collected data to staff. Aiding sport scientists and coaches in decision making around players.
TEX explained
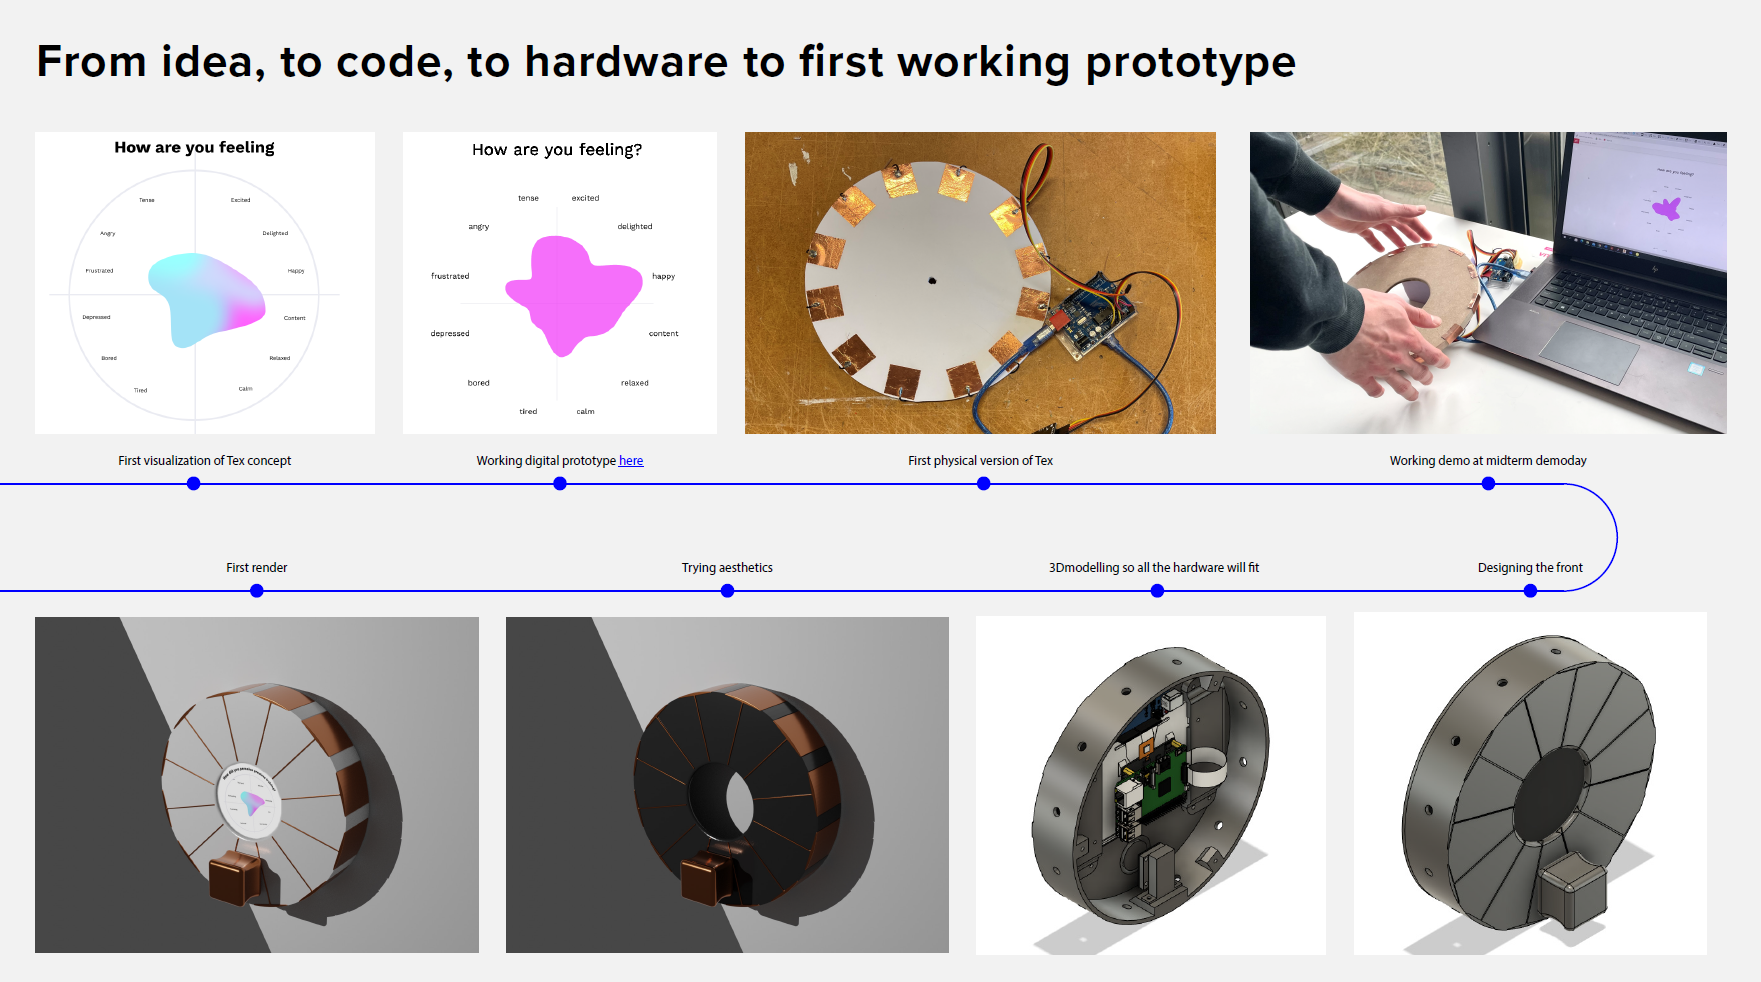
Process
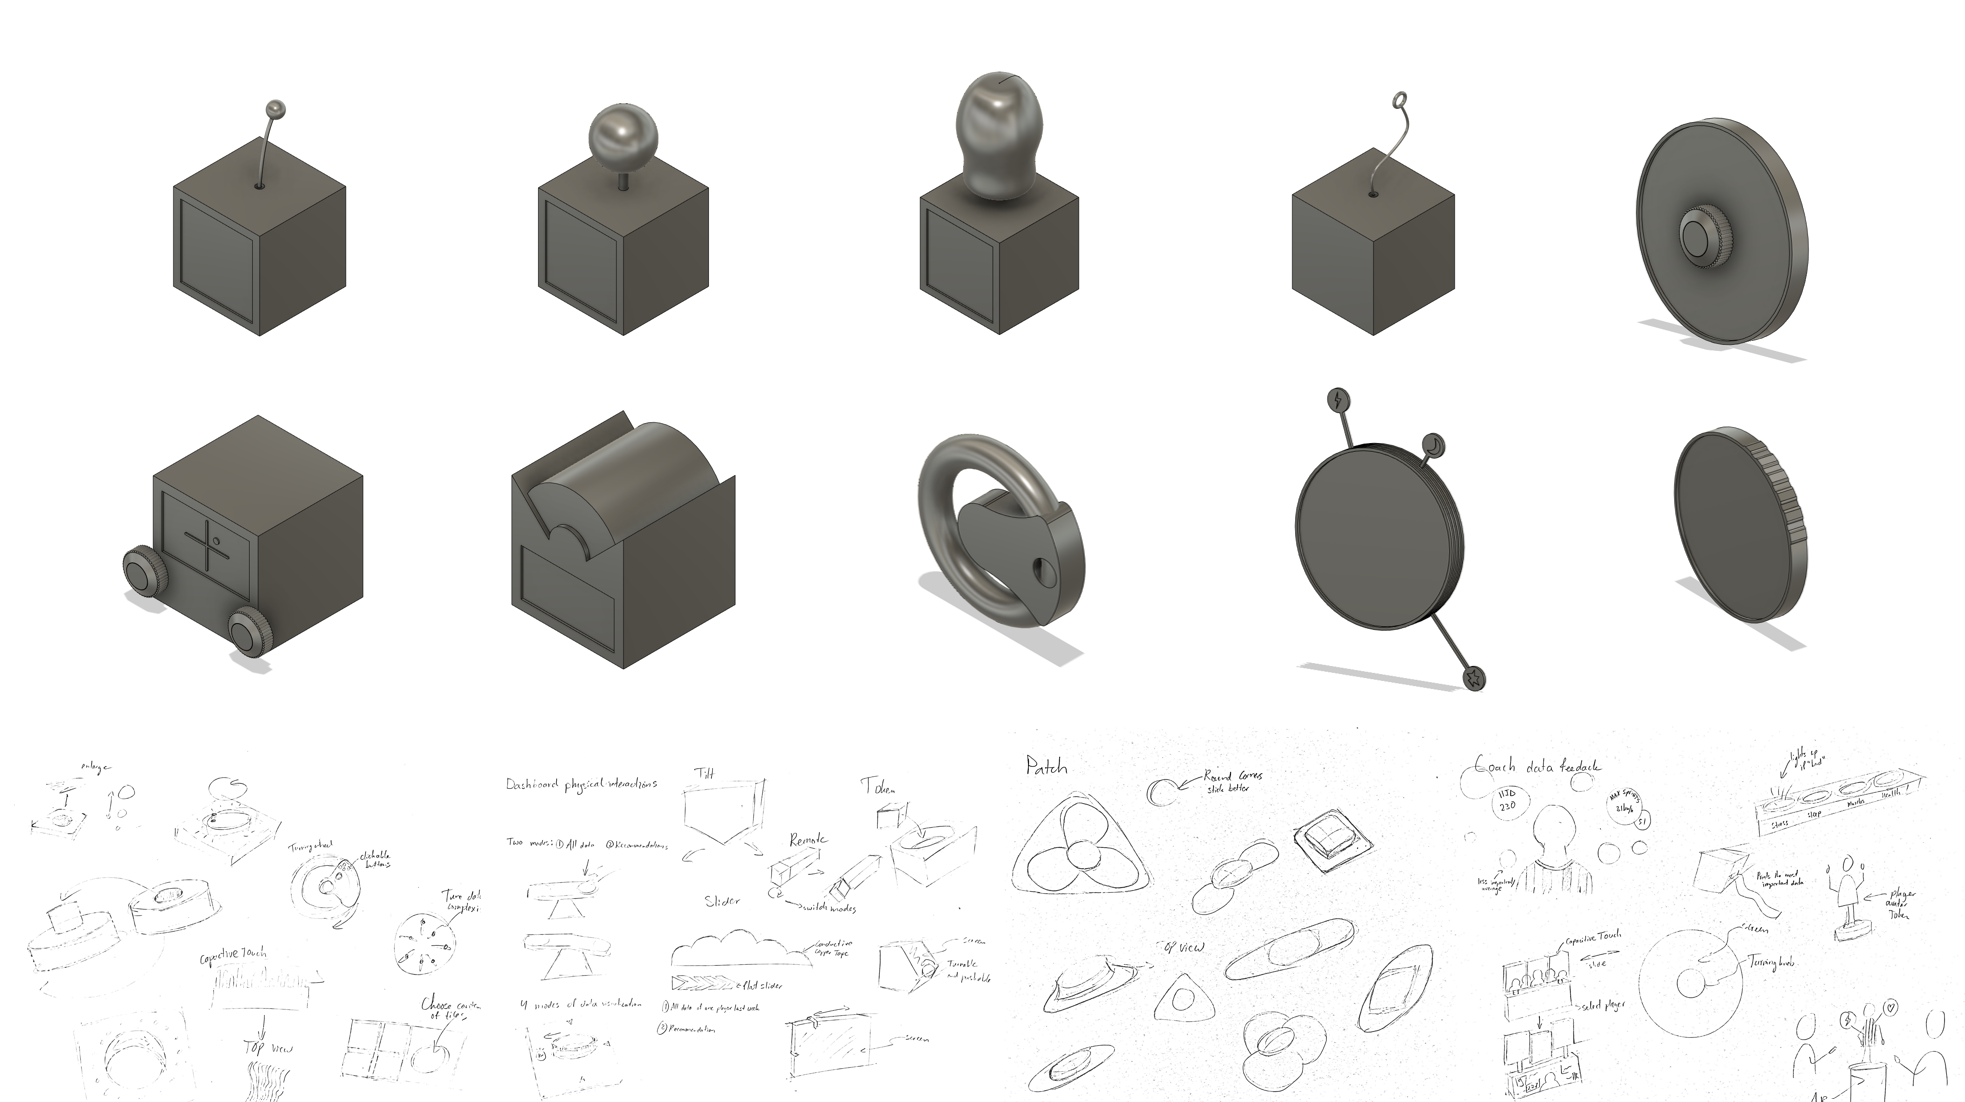
This project started with the question: How can we design novel, engaging and ubiquitous interventions, which can gather contextual, situational, and subjective data for hybrid datasets (i.e., datasets which include both objective and situational data)?
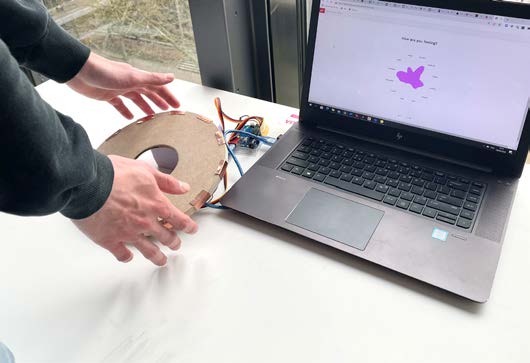
Try out the initial digital demo
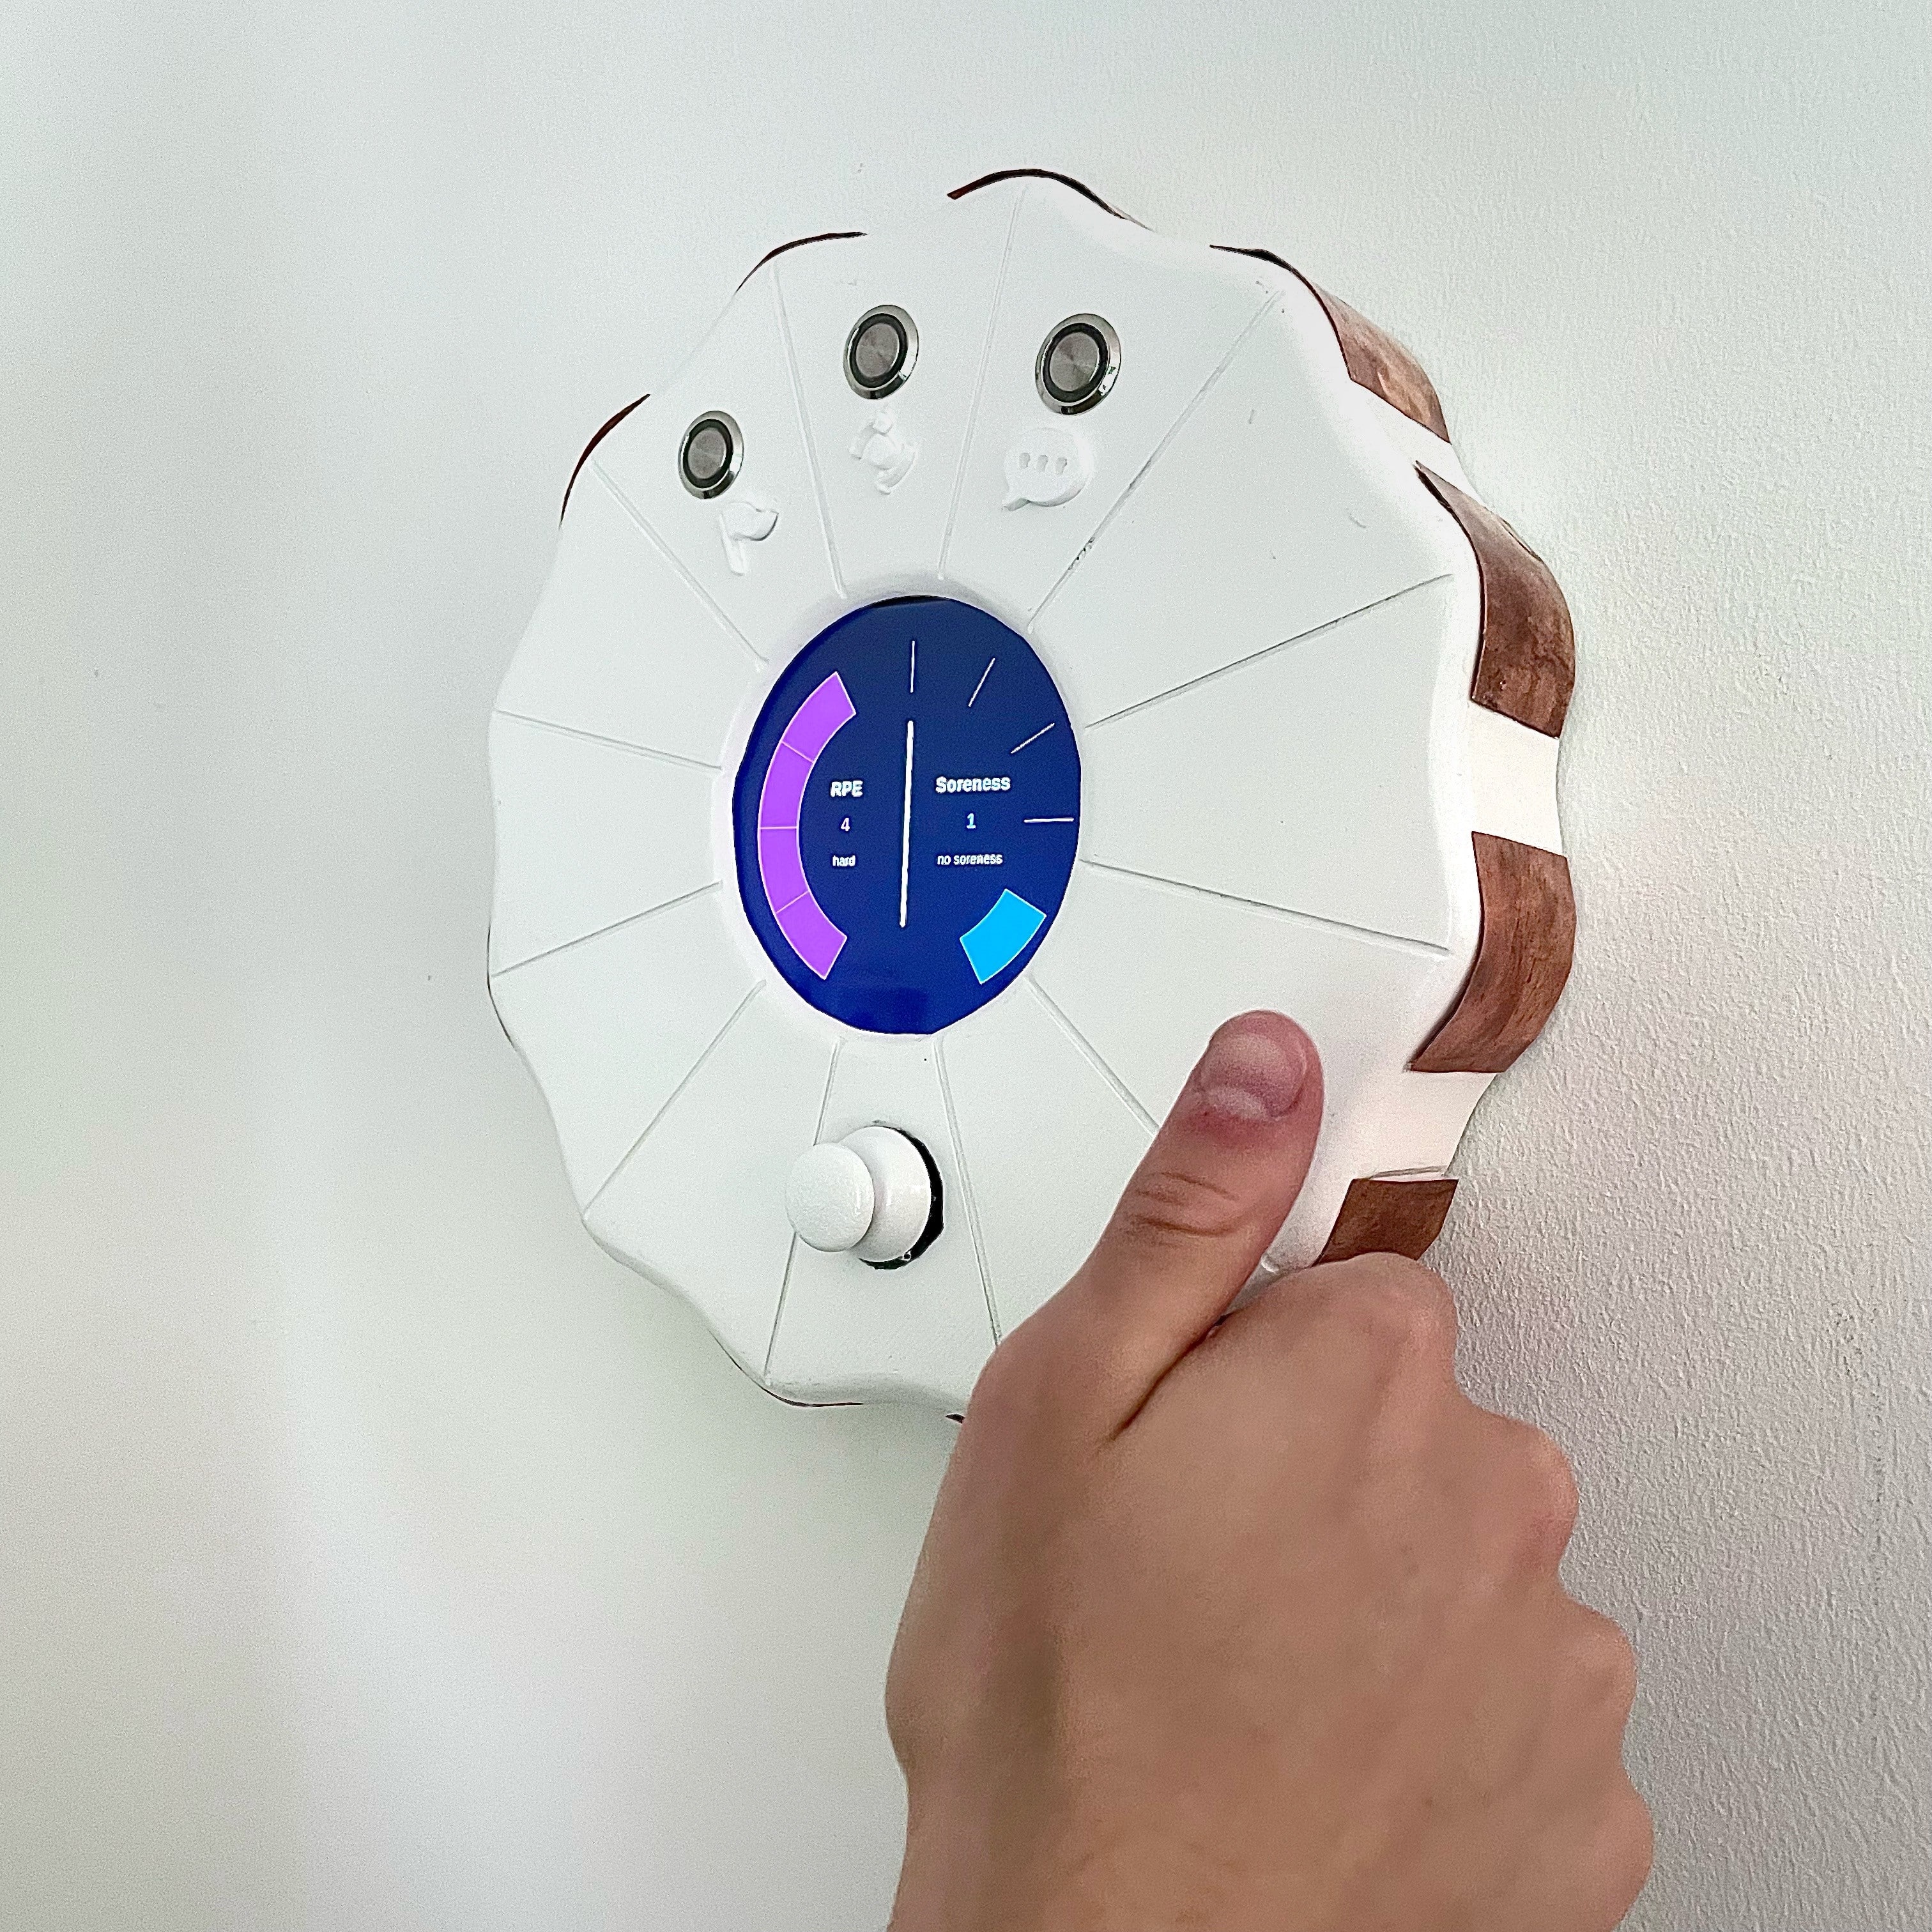
Tex is a redesign of the current well-being questionnaire at PSV.Together with a sport scientist questions have been altered or even removed to improve efficiency and quality of information. There are five daily questions and three optional questions. When you press the button and answer the life event question this event gets logged until you remove it. Important to note is that life events only need to be logged if it affects your well-being. Menstruation symptoms logging is also optional and only needed when it affects your well-being.
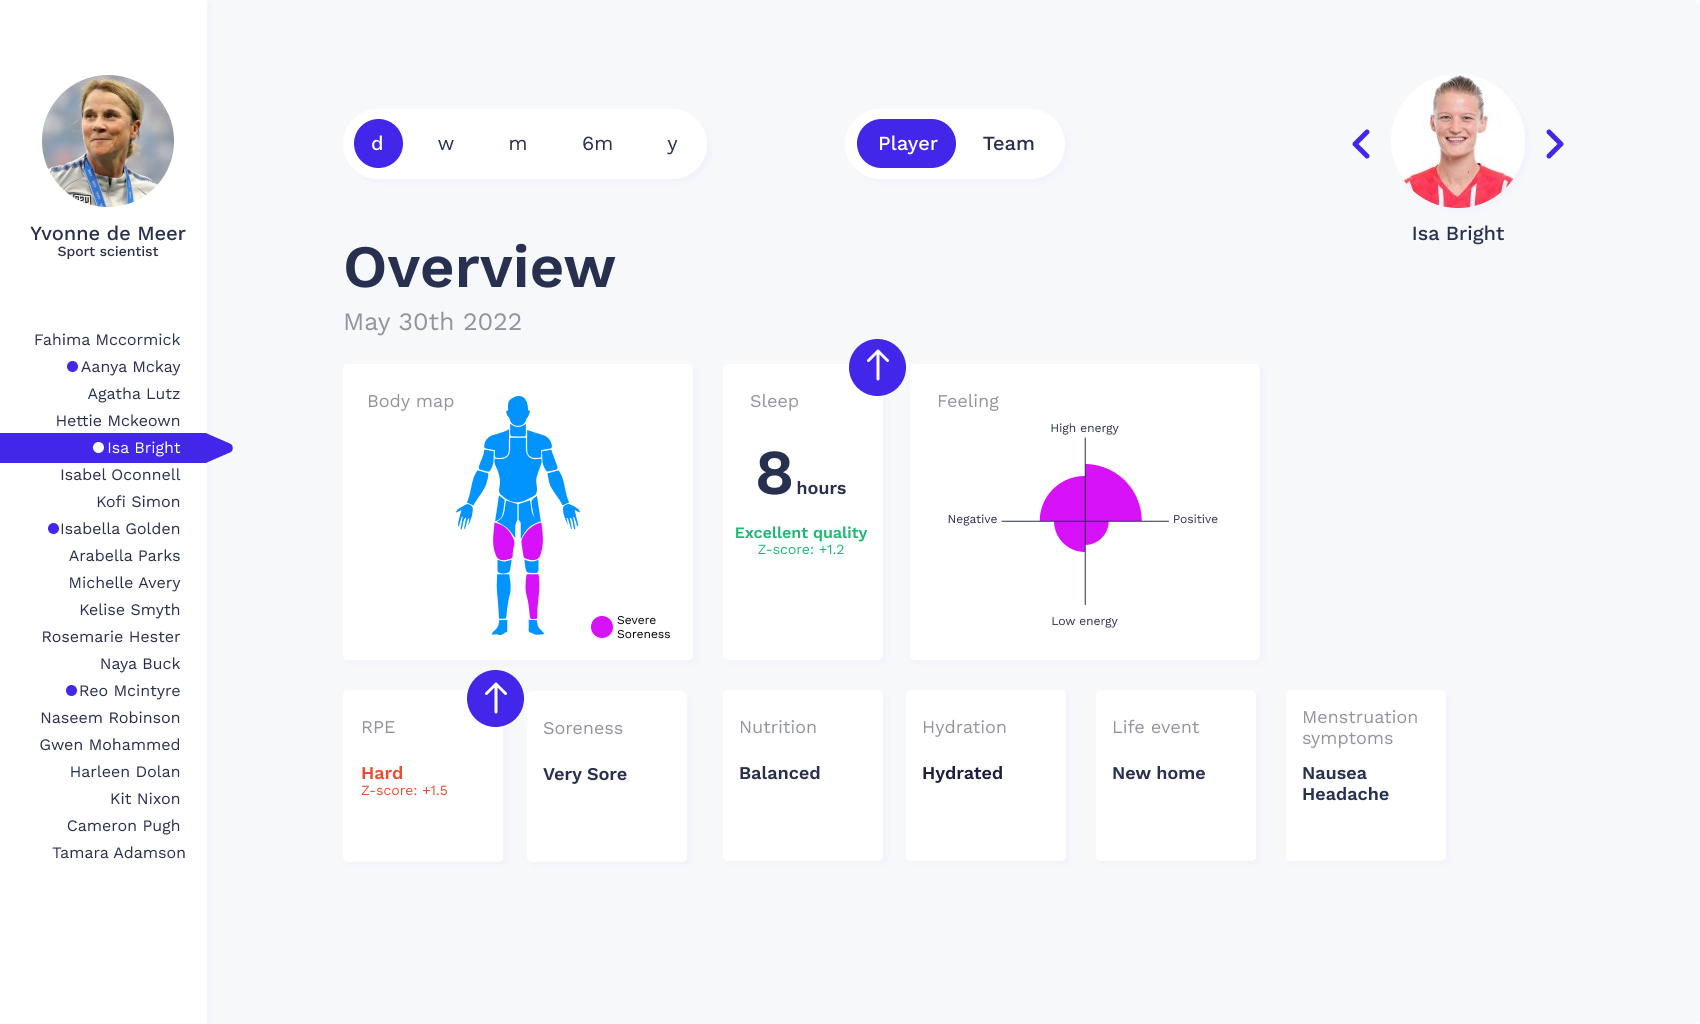
A digital platform has been designed in Figma together with a sport scientist from PSV. This dasboard summarizes the feeling question for instance into; high energy, low energy, negative, and positive. Questions combined in the questionnaire are also combined in the graphs. Color coding is used to highlight statistical differences and with z-scores the difference is communicated. Some measures are so personal it would not make sense to summarize them in a team overview. Think about life event or menstruation related data.